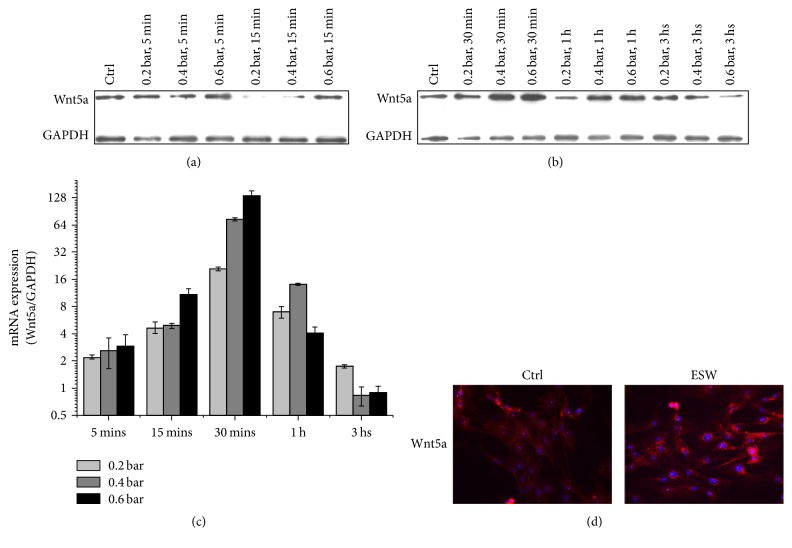
Figure 4.
Wnt5a expression following the intervention with various ESW energy levels. (a, b) BMMSCs were exposed to ESW (0.2 bar, 0.4 bar, and 0.6 bar, 6 Hz, and 1000 shots) and detected at various time points as indicated. The expression of Wnt5a was analyzed by western blots. (c) BMMSCs were exposed to ESW (0.2 bar, 0.4 bar, and 0.6 bar, 6 Hz, and 1000 shots) and detected at various time points as indicated. The mRNA was extracted from the cell lysates, and Q-RT-PCR with the primers of Wnt5a and GAPDH (internal control) was performed as described in Methods. The quantitative data were shown as 2−ΔΔct (n = 4). (d) Immunofluorescence of Wnt5a in BMMSCs. BMMSCs were treated with or without ESW (0.6 bar, 6 Hz, and 1000 s). Scale bar = 100 µm. Thirty minutes after ESW intervention, cells were prepared for immunofluorescence and pictures were taken under a fluorescence microscope using a ×40 objective.

