
Figure 5.
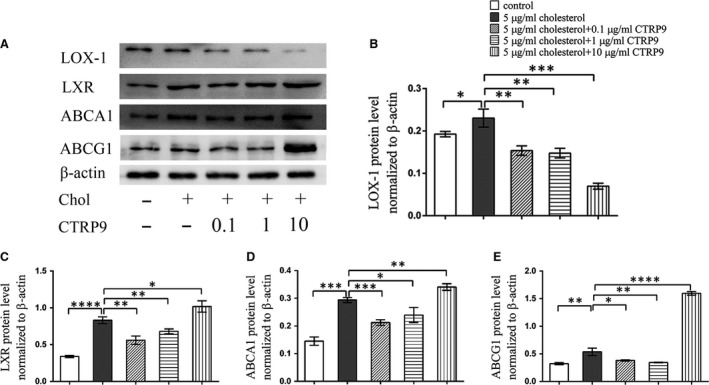
CTRP9 regulates cholesterol metabolism‐related proteins expression in VSMCs VSMCs were treated for 72 hrs with different concentrations of CTRP9 (0–10 μg/ml) in the presence of 5 μg/ml cholesterol or were left untreated (control). (A) Representative Western blot of differently treated VSMCs to examine LOX‐1, LXR, ABCA1 and ABCG1 expression. (B–E) Quantification of Western blot images. Values represent the mean ± S.D. and are representative of three independent experiments. *P < 0.05, **P < 0.01, ***P < 0.001, ****P < 0.0001.