
Figure 4.
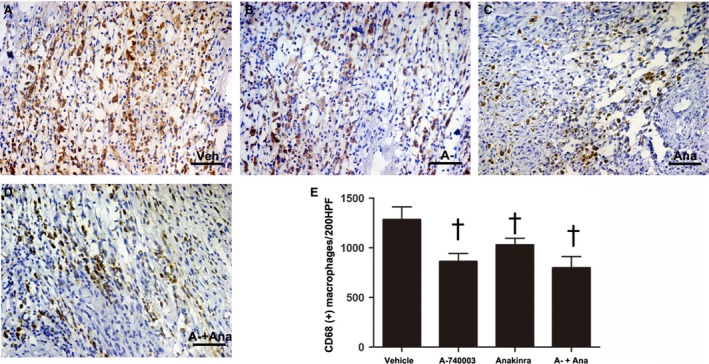
Representative immunohistochemical images of infarcted macrophage infiltration at 7 days post‐MI as indicated by the macrophage marker CD68 (yellow) and nuclei (blue) were stained with haematoxylin in the (A) vehicle‐MI (Veh), (B): A‐740003‐MI (A‐), (C) Anakinra‐MI (Ana) and (D): A‐740003 + Anakinra‐MI (A‐+Ana) groups. (E) Quantification of infiltrated macrophages at the infarcted border. Bar = 30 μm. † P < 0.05 compared with vehicle.