
Figure 5.
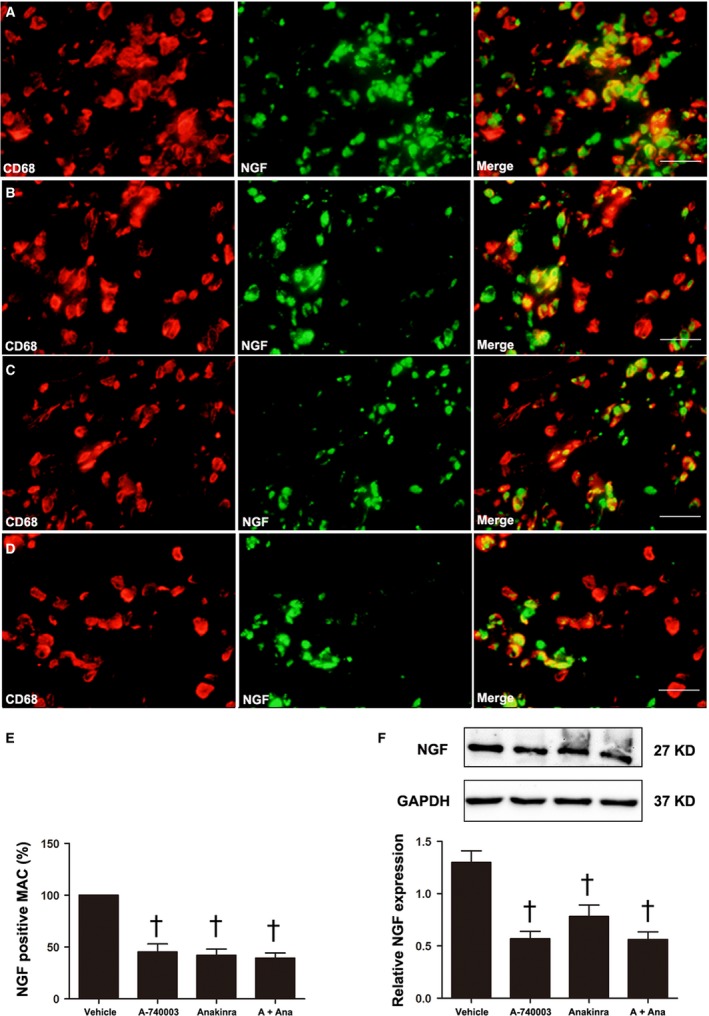
The effect of P2X7R and IL‐1β on macrophage‐dominated nerve growth factor (NGF) production at 7 days post‐MI. Merged images (n = 5) resulting from double‐immunostaining for CD68 (red) as a macrophage marker and NGF (green) in vehicle‐ (A), A‐740003‐ (B), A‐740003 + Anakinra‐ (C) or Anakinra‐treated rats (D). (E) The percentage of NGF‐ir macrophages. Western blot and quantitative analysis of NGF (27 kD) in homogenates of the LV from the infarcted border zone (F). Bar = 30 μm. The results are shown as the mean ± S.D. of three independent experiments. † P < 0.05 compared with vehicle.