
Figure 7.
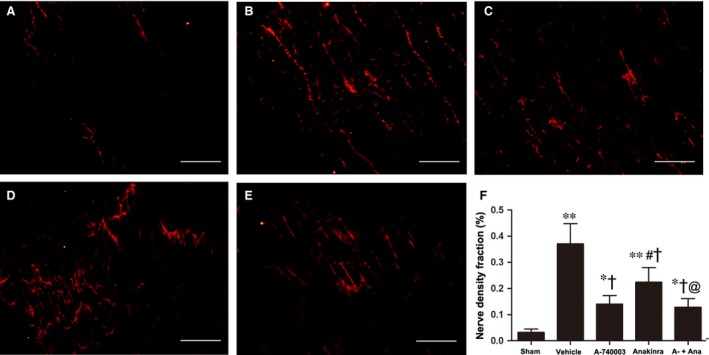
Immunofluorescent staining for growth‐associated protein 43 at the infarcted border (magnification 200 × ) in the (A) sham, (B) vehicle‐MI, (C) A‐740003‐MI, (D) Anakinra‐MI and (E) A‐740003 + Anakinra‐MI groups. Bar = 50 μm. (F) Fraction of the nerve density area (%) at the infarcted border. Each column with a bar represents the mean ± S.D. **P < 0.01 and *P < 0.05 compared with sham; † P < 0.05 compared with vehicle; # P < 0.05 compared with A‐740003; and @P < 0.05 compared with Anakinra (n = 8–10 per group).