
Figure 8.
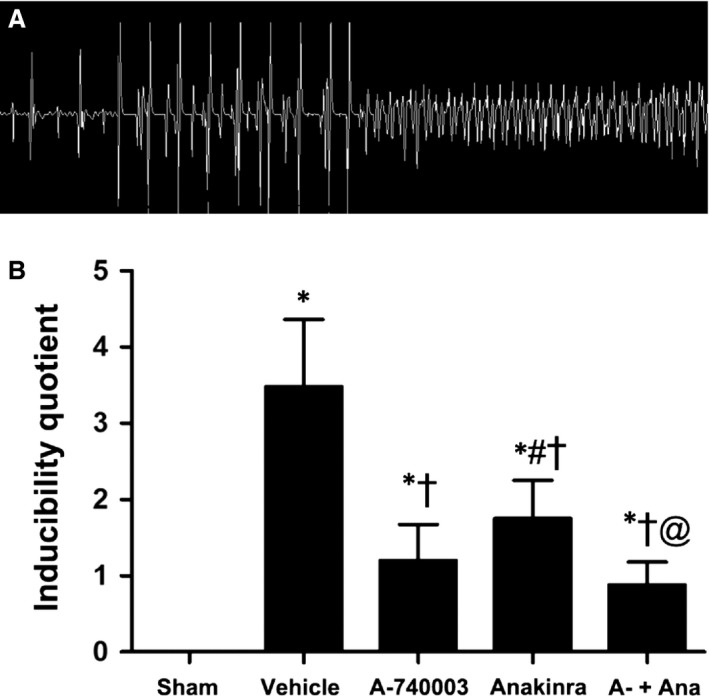
Programmed electrical stimulation at 7 days post‐MI. (A) Recordings of typical inducible VAs. (B) Comparisons of the arrhythmia scores between four groups 1 week after surgery (n = 5–6 for each group). *P < 0.01 compared with sham; † P < 0.05 compared with vehicle; # P < 0.05 compared with A‐740003; and @P < 0.05 compared with Anakinra.