
Figure 9.
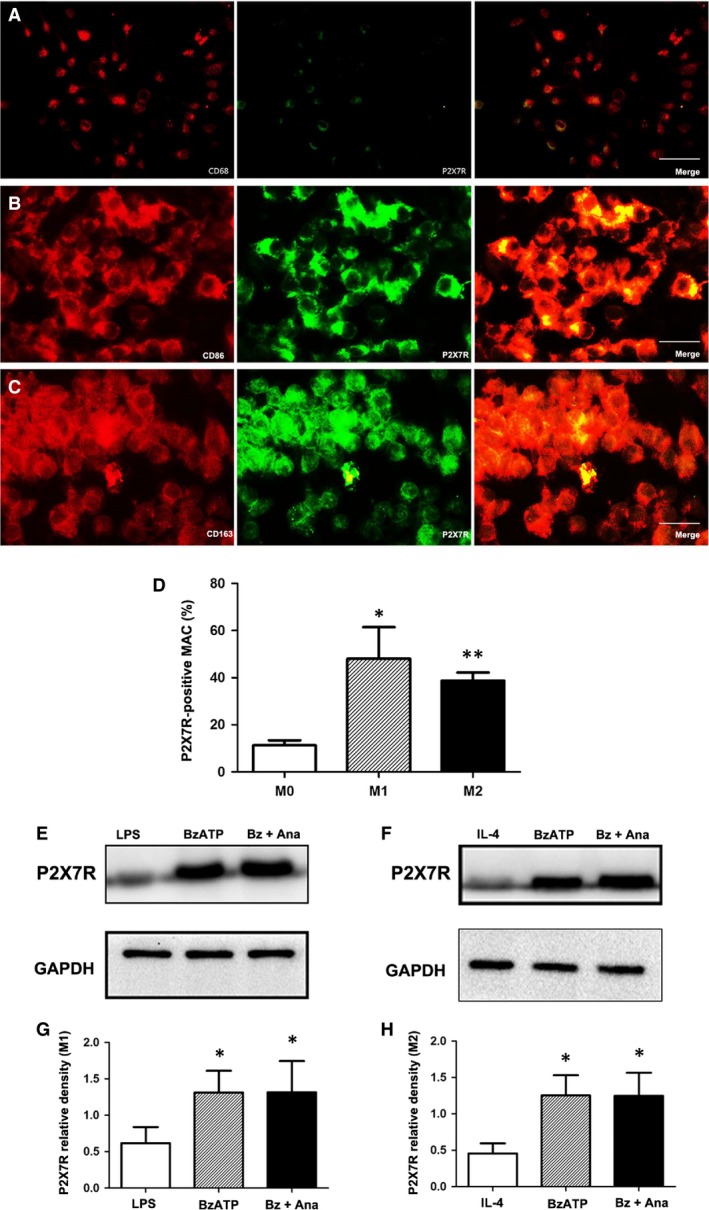
P2X7R expression in M1 and M2 macrophages. Representative double‐immunostained images of CD68 (A), CD86 (B) and CD163 (C) (red); P2X7R (green); and DAPI (blue) for nuclei (magnification ×400). Bar = 30 μm. (D) Fraction of P2X7R‐positive M0, M1 and M2 macrophages. Representative protein expression levels of P2X7R (80 kD) in M1 (E and G) and M2 (F and H) macrophages as determined by Western blotting. Protein levels were quantified relative to GAPDH (37 kD) levels. The data are expressed as the mean ± S.D. of two experiments. *P < 0.05 and **P < 0.01 versus the M0 (D) or sham groups (G and H).