
Figure 10.
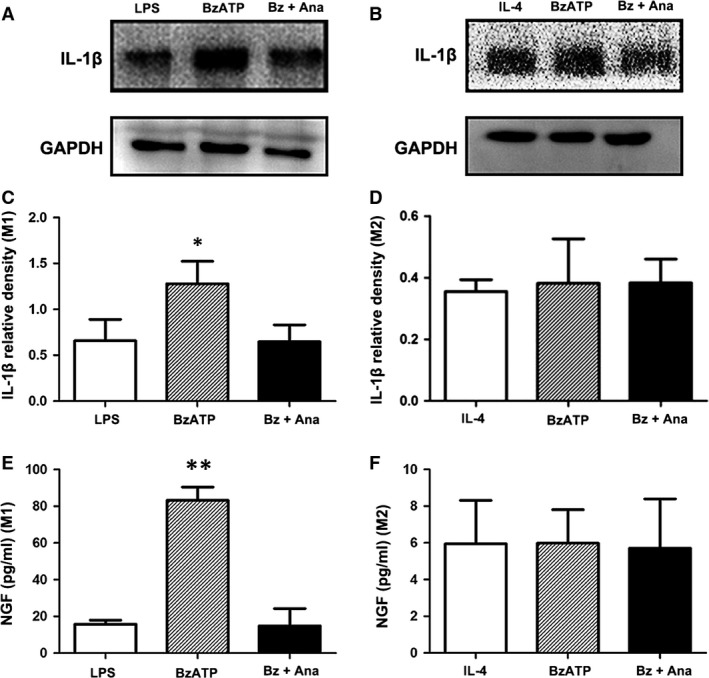
P2X7R activation induced nerve growth factor (NGF) release in M1 macrophages via IL‐1β production. Representative protein expression levels of IL‐1β (17 kD) in M1 (A, C) and M2 (B, D) macrophages in the presence or absence of Anakinra as determined by Western blotting. The quantification was carried out relative to the GAPDH (37 kD) levels. The cytokine levels of NGF in the cultured supernatants of M1 (E) and M2 macrophages (F) as measured by ELISA. Each column with a bar represents the mean ± S.D. **P < 0.01 and *P < 0.05 compared with the sham group.