
Figure 6.
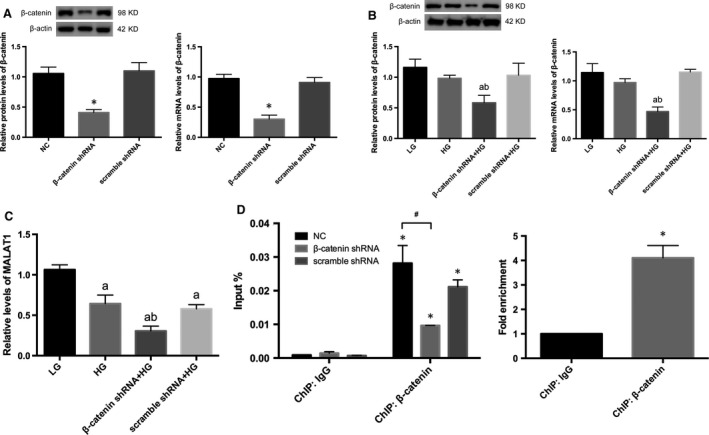
Effects of β‐catenin knock‐down on MALAT1. (A) β‐catenin knock‐down efficiency was determined by Western blot and real‐time PCR analysis. Results demonstrated a significant abrogation of β‐catenin expression after transduction of lentiviral shRNAs. Podocytes under normal conditions or transfected with scramble shRNA were the controls. *P<0.01 versus NC or scramble shRNA. (B) β‐catenin shRNA significantly inhibited β‐catenin expression on both protein and mRNA levels. Podocytes under culture of LG or transfected with cont siRNA were the controls. Values denote the mean ± S.D.; aP < 0.01 versus LG,bP < 0.01 versus HG. (C) β‐catenin knock‐down resulted in a further degree of MALAT1 down‐regulation, in comparison with that in podocytes in exposure of HG. Podocytes under culture of LG or transfected with cont siRNA were the controls. Values denote the mean ± S.D.; aP < 0.01 versus LG,bP < 0.01 versus HG. (D) ChIP analysis using anti‐β‐catenin or anti‐IgG antibodies were performed either in cultured mouse podocytes with or without β‐catenin shRNA transfection, or in human 293 cells. Real‐time PCR was used for the detection of the ChIP signals. Values denote the mean ± S.D.; *P < 0.01 versus IgG, # P < 0.01 versus NC.