
Figure 1.
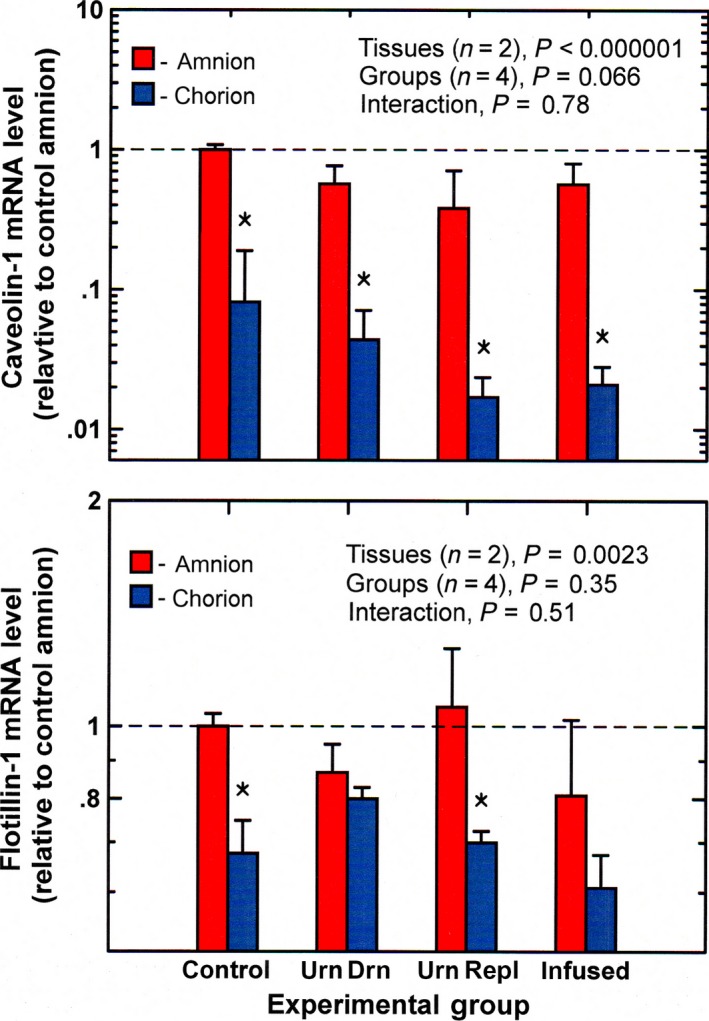
Caveolin‐1 and flotillin‐1 mRNA levels (mean ± SE, n = 4) in ovine amnion and chorion under control and experimental conditions. Data in this and subsequent figures are normalized to mean mRNA levels in control amnion (horizontal dashed line) urn drain, continuous drainage of fetal urine without fluid replacement; urn repl, urine drainage with isovolumic fluid replacement; infused, continuous infusion of lactated Ringer's solution (2 L/day) into the amniotic fluid. *P < 0.05, chorion level compared to amnion level for the same experimental group.