
Figure 1.
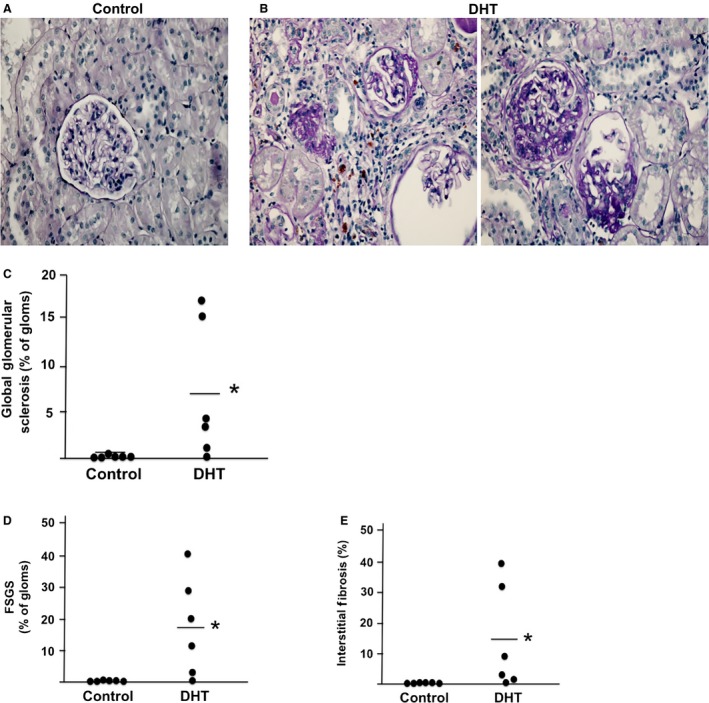
Morphological analyses of kidneys from aging hyperandrogenemic females and controls. (A and B) Representative micrograph of kidneys of control (A) and DHT‐treated (B) aging female kidneys (magnification = 20×). Evaluation of PAS‐stained sections was performed for (C) Global sclerosis; (D) Focal segmental glomerulosclerosis (FSGS); (E) Interstitial fibrosis (n = 6/group for all figures). *P < 0.5, compared with control group.