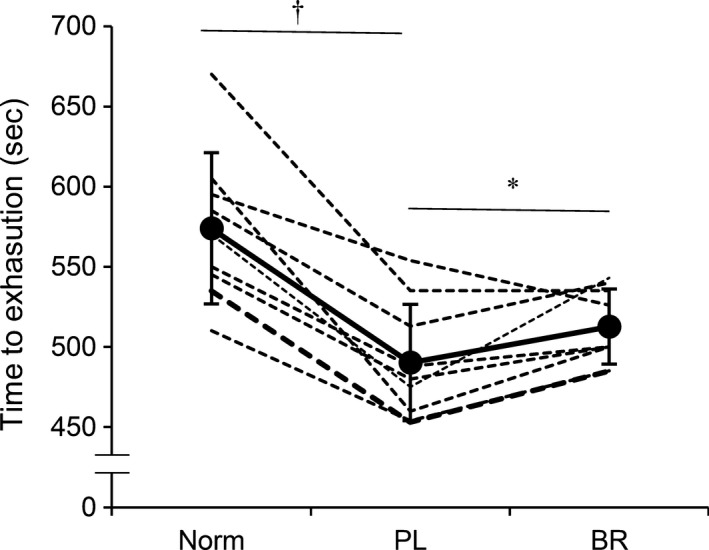
Figure 2.

Time‐to‐exhaustion during maximal incremental exercise under normoxia (Norm), after placebo (PL) and beetroot (BR) supplementation. Dotted lines indicate an individual data, and the solid line indicates averaged values. Values are the means ± standard deviation (SD). *P < 0.05 between PL and BR, †P < 0.05 between Norm and PL.
