Figure 5.

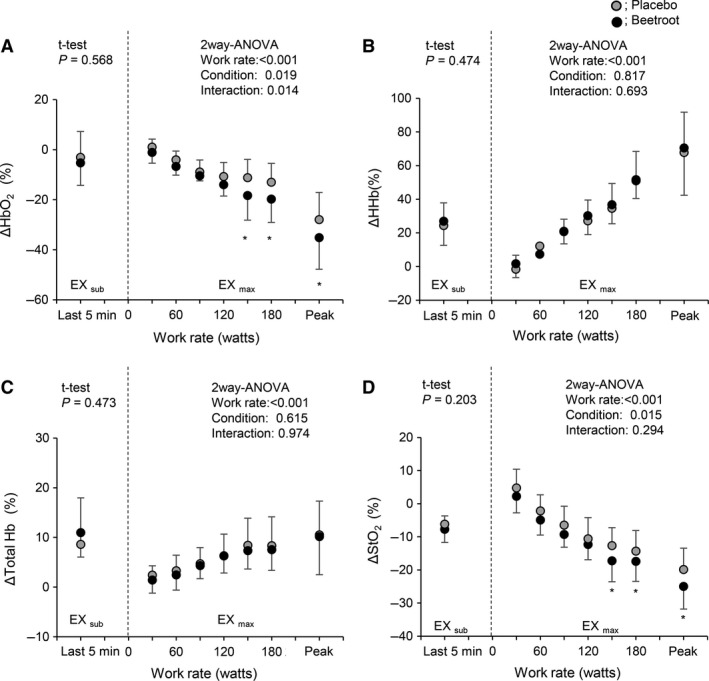
Relative changes from baseline values in each near infrared spectroscopy signal in inactive muscle during EXsub and EXmax between PL and BR trials. Values are the means ± SD. * P < 0.05 between PL and BR within the same work rates.

Relative changes from baseline values in each near infrared spectroscopy signal in inactive muscle during EXsub and EXmax between PL and BR trials. Values are the means ± SD. * P < 0.05 between PL and BR within the same work rates.