
Figure 1.
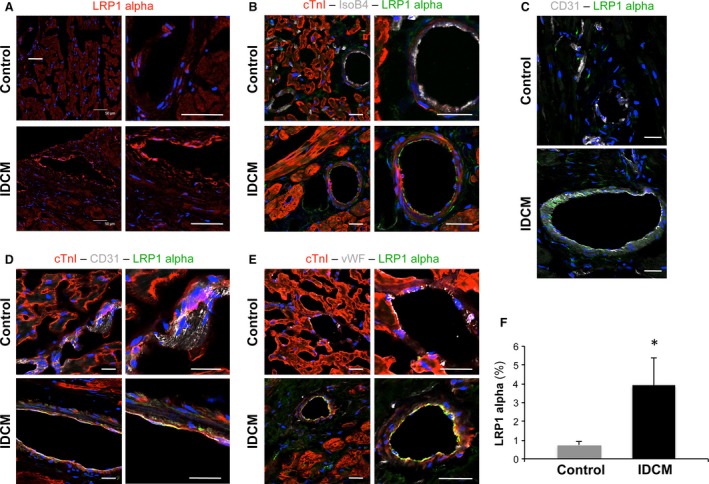
Analysis of myocardial LRP1 α chain expression and localization. Representative confocal microscope images showing specific global detection of LRP1 α chain (red) (A) and more detailed localization of LRP1 α chain (green) in IsoB4—(grey) (B), CD31—(grey) (C and D) and vWF—(grey) (E) positive vessels. Cardiac muscle and cell nuclei are counterstained using an anti‐cTnI antibody (red) and DAPI (blue), respectively. Scale bars = 50 μm (F) Histogram represents quantification of LRP1 α chain positivity as percentage of arbitrary units per area. *P = 0.02.