
Figure 1.
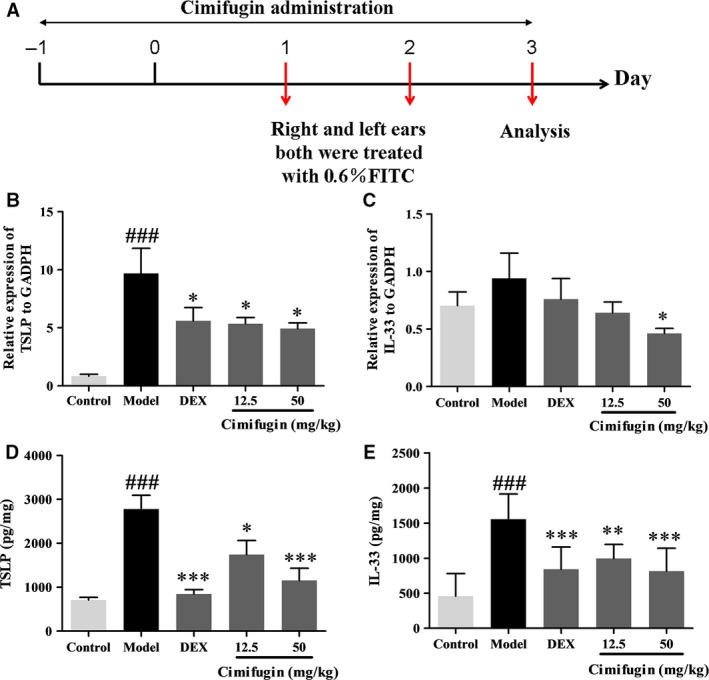
Effects of cimifugin on TSLP and IL‐33 in the initial stage of AD model in vivo. (A), Flow charts of the initial stage of AD model. (B, C), TSLP and IL‐33 mRNA expressions in ear homogenates were analysed by qPCR. (D, E), TSLP and IL‐33 protein expressions were analysed by ELISA and total protein were examined by BCA kit. TSLP and IL‐33 level were performed as concentration of TSLP or IL‐33/total protein (pg/mg). (mean + SD, n = 8, ### P < 0.001 versus control,*P < 0.05, **P < 0.01, ***P < 0.001 versus model). The data are representatives of three independent experiments.