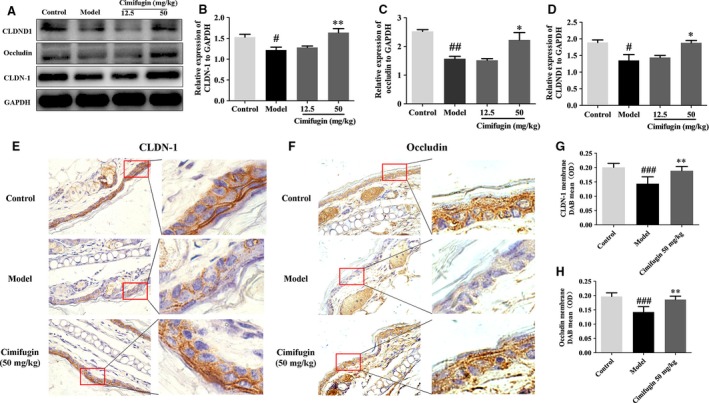
Figure 4.

Effects of cimifugin on the TJs expressions in the initial stage of AD model. (A), CLDND1, CLDN‐1 and occludin expressions were analysed by Western blot (n = 3). (B–D), CLDND1, CLDN‐1 and occludin expressions relative to GAPDH were quantified by ChemiScope analysis. (E), Immunohistochemical analysis of CLDN‐1 and occludin expression (n = 5, magnification: ×630). (F–H), CLDN‐1 and occludin mean DAB intensity were quantified by Mantra Quantitative Pathology Workstation (mean + SD, n = 5, # P < 0.05, ## P < 0.01, ### P < 0.001 versus control, *P < 0.05, **P < 0.01 versus model). The data are representatives of three independent experiments.
