
Figure 2.
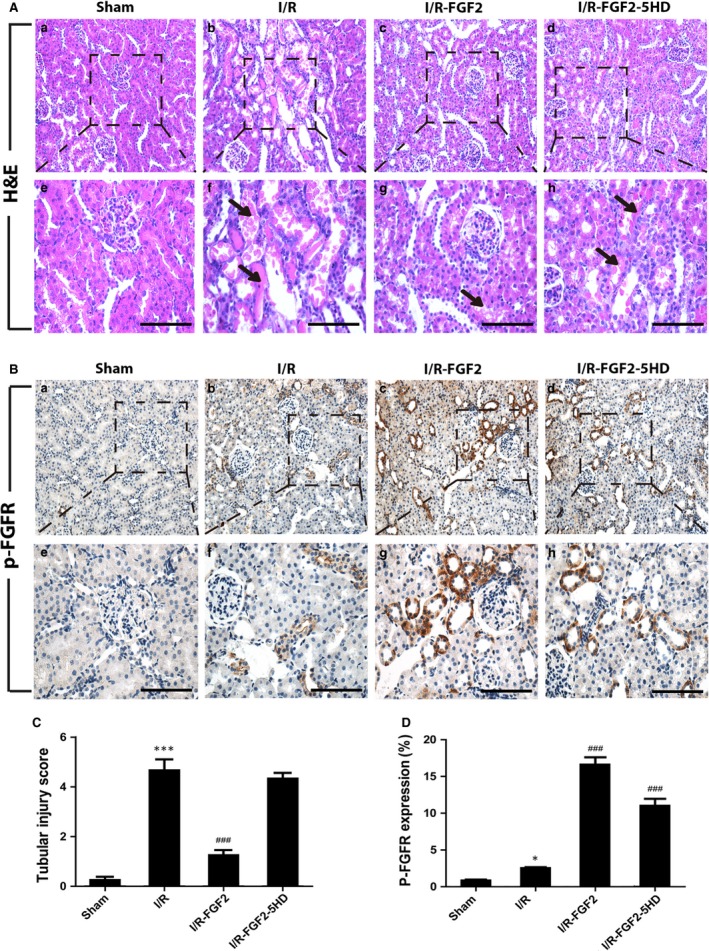
FGF2 protects renal histological integrity and robustly activates FGFR. (A) Histological evaluations of renal tissue with H&E after 2 days of reperfusion (original magnification ×20 and ×40, respectively). Arrows show intraluminal necrotic cellular debris, interstitial congestion and oedema, and formation of proteinaceous casts. Scale bars represent 50 μm. (B) Immunohistochemical staining for phospho‐FGFR (p‐FGFR, original magnification ×20 and ×40, respectively). Scale bars represent 50 μm. (C) Renal tubular injury scores were calculated based on H&E staining using the criteria and procedure described in the material and methods. Results are representative of eight animals in each group. ***P < 0.001 versus sham group), ###P < 0.001 versus I/R group. Results are representative of eight animals in each group. (D) Quantification and statistical analysis of p‐FGFR positive cells in the kidney. Data are representative of five animals in each group. *P < 0.05 versus sham group.