Figure 5.

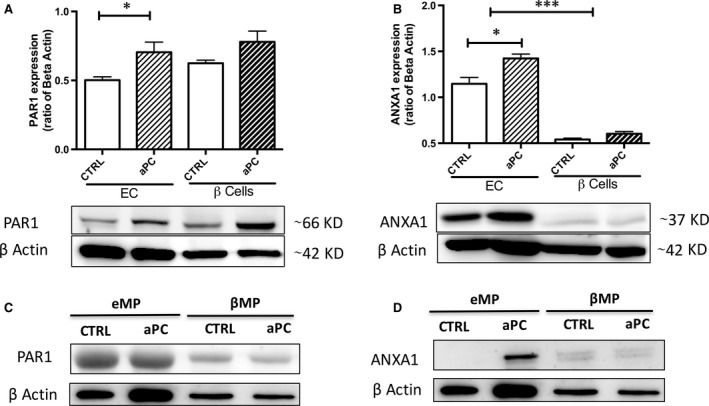
Expression of annexin A1 and PAR‐1 in eMPaPC. After 70 nM aPC treatment during 24 hrs, endothelial cells and β cell‐derived MP were harvested from supernatants, washed and concentrated. Expression of PAR‐1 (A, C) and annexin A1 (B, D) were assessed by Western blot in cell (A, B) (n = 4) and MP lysates (C, D) (n = 3). Data expressed as mean ± S.E.M. (aPC, activated protein C (Xigris®); CTRL, untreated cells; βMP, β‐cell derived MP; EC, endothelial cells; eMP, endothelial MP; MP, microparticles; PhSer eq., phosphatidylserine equivalent. *P < 0.05 versus CTRL ***P < 0.001 versus CTRL).
