Figure 4.
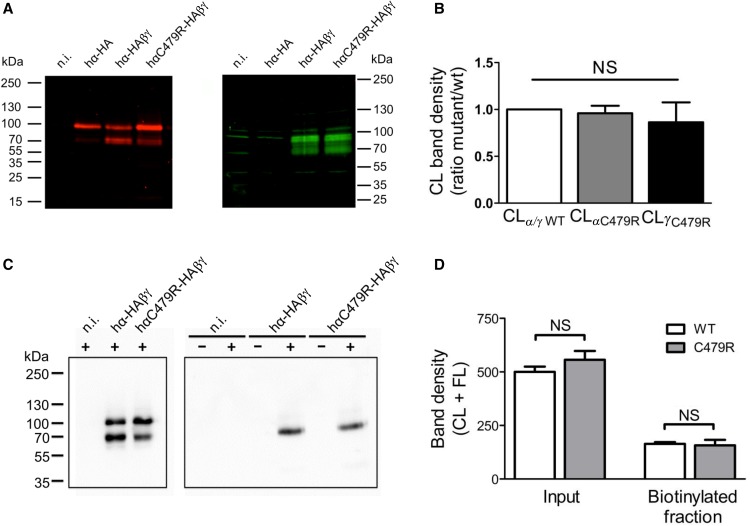
C479R does not increase channel surface density. (A) Anti-HA tag (red; left panel) and anti-γENaC (green; right panel) Western blot analysis of Triton-soluble fractions from Xenopus oocytes noninjected (n.i.) or injected with cRNAs for hα-HA alone or with β- and γENaC cRNAs together with either the wild type (wt) or C479R mutant hα-HA. (B) The intensities of the bands corresponding to CL hα- and hγENaC were normalized to the amount of 2,2,2-Trichloroethanol–labeled total protein obtained for each lane on the blot. The ratios between the thus-calculated values for hα- and hγENaC in the hαwtβγENaC and those for hαC479RβγENaC are shown in the graph. Data correspond to mean±SEM (ten blots from seven independent experiments); differences are NS. (C, right panel) Anti-HA immunoblot analysis of neutravidin-bound fractions isolated from control (−) or cell surface biotinylated (+) Xenopus oocytes n.i. or injected with either αwt-HA/β/γ or αC479R-HA/β/γ cRNAs. (C, left panel) Inputs corresponding to 1% of the Triton-soluble preparations from biotinylated oocytes used in the pull-down experiments. (D) Values (mean±SD) of CL + FL band intensities of inputs or neutravidin-bound fractions corresponding to experiments shown in C. Results from four blots with samples of four independent experiments. Differences are NS.

