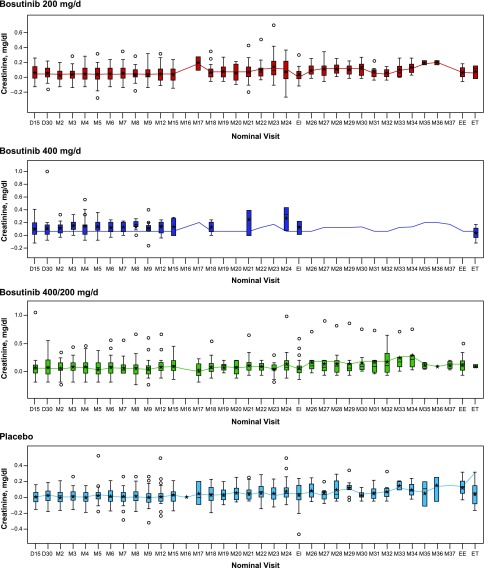
Figure 2.
No significant change in serum creatinine over time. Boxes represent the 25th, 50th, and 75th percentiles; whiskers represent an extension of 1.5× the interquartile range; stars represent mean value; circles represent individual values out of interquartile range. D, day; EE, end of extended treatment; EI, end of initial treatment; ET, early termination; M, month.

