Figure 6.
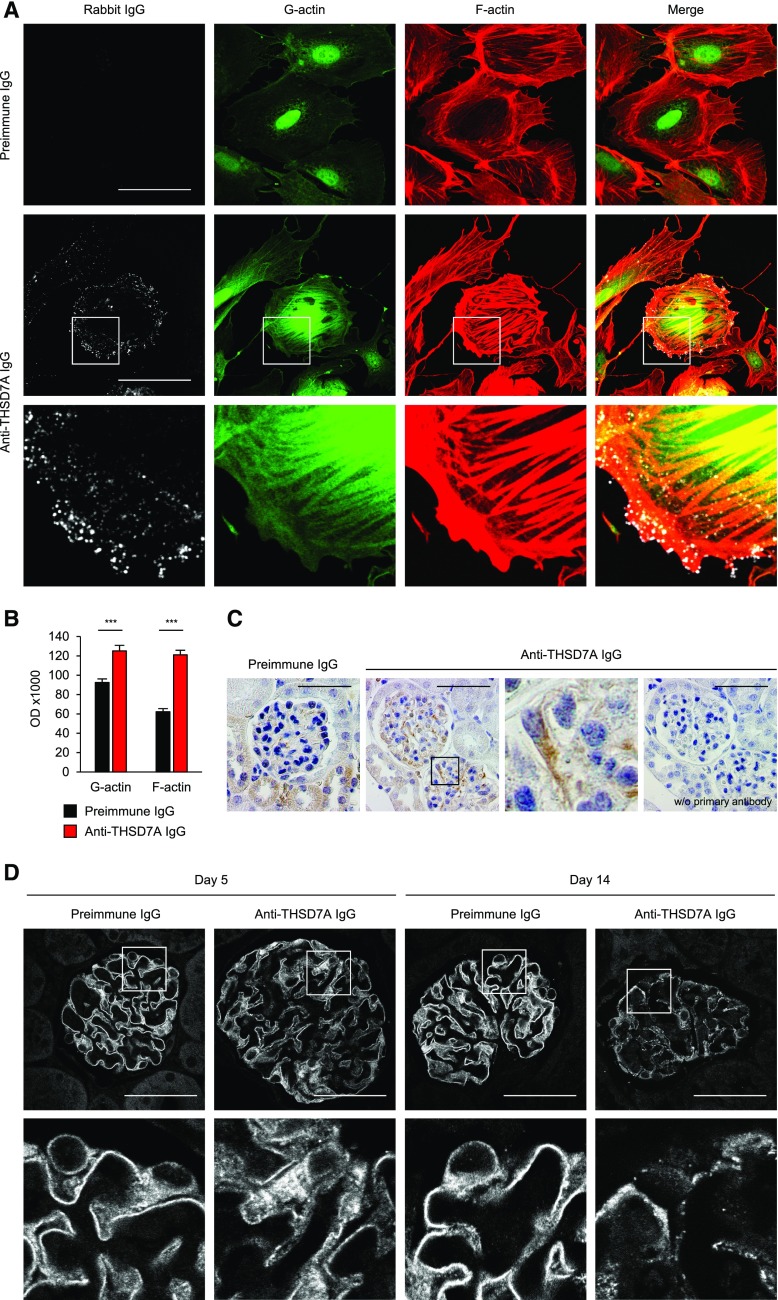
Anti-THSD7A antibodies and podocyte damage. (A) Immunofluorescence staining for rabbit IgG, G-actin, and F-actin (phalloidin) in primary cultured GECs after a 1-hour incubation with 1:100 preimmune or anti-THSD7A IgG (Rabbit IgG [AF488], G-actin [FITC], F-actin [AF568]). Lower panels represent 4× enlargements of the boxed areas in the middle panels. Scale bars indicate 50 µm. (B) Quantification of stress fiber formation after treatment of GECs with preimmune or anti-THSD7A IgG. One hundred images from three independent experiments were analyzed. Data indicate mean±SEM of actin optical density of individually circled cells. ***P<0.001, two-tailed nonparametric Mann–Whitney U test. (C) Immunohistochemical staining for SOD2 in mice 14 days after injection of preimmune or anti-THSD7A IgG (SOD2 [AF488]). The third panel represents a 4× enlargement of the boxed area in the second panel. As the antibody against SOD2 is derived from rabbits, we performed an additional control using the secondary anti-rabbit antibody only on a consecutive section of the diseased mouse (right panel). Scale bars indicate 50 µm. (D) Immunofluorescence staining for nephrin in mice 5 days and 14 days after injection of preimmune IgG or anti-THSD7A IgG. Scale bars indicate 50 µm (Nephrin [C2]). Lower panels represent 4× enlargements of the boxed areas above.

