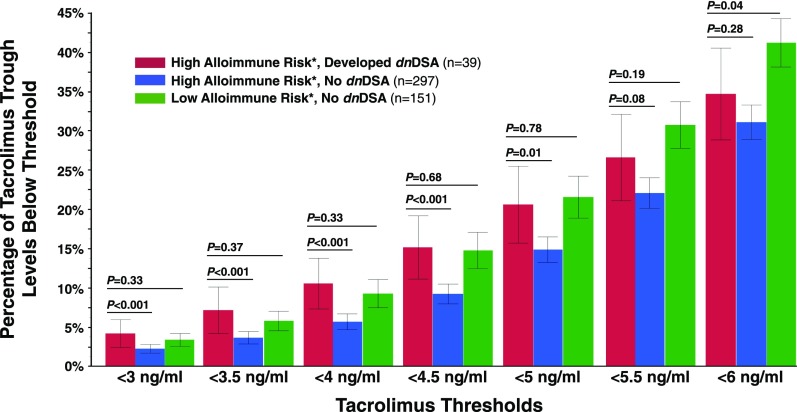
Figure 6.
Eplet mismatch modulates the effect of tacrolimus trough levels on the development of dnDSA. High risk: HLA-DR or -DQ eplet mismatch >11; low risk: HLA-DR and -DQ eplet mismatch ≤11. P values represent a comparison of high-risk patients who developed dnDSA with high-risk patients who did not develop dnDSA and a comparison of high-risk patients who developed dnDSA with low-risk patients who did not develop dnDSA. Values represent the mean percentages of tacrolimus trough levels below each threshold and their corresponding 95% confidence intervals.

