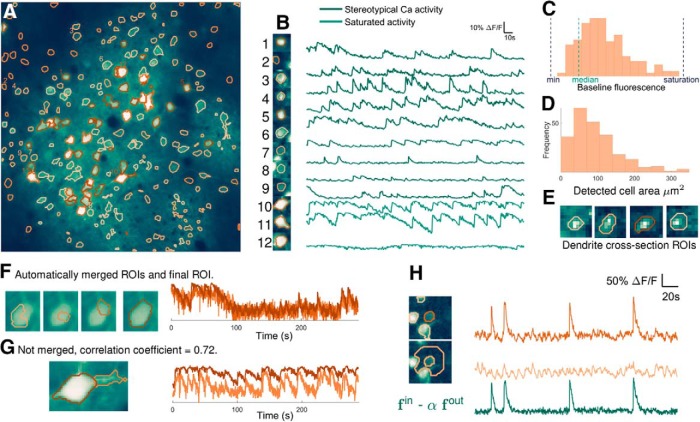
Figure 2.
ABLE detects cells with varying size, shape, and baseline intensity from mouse in vivo imaging data. The 236 detected ROIs are superimposed on the mean image of the imaging video (A). Extracted neuropil-corrected time series and corresponding ROIs are displayed for a subset of the detected regions (B). Cells with both stereotypical calcium transient activity (B, 1–9) and saturating fluorescence (B, 10–12) are detected. The performance of ABLE does not deteriorate due to intensity inhomogeneity: ROIs with baseline fluorescence from beneath the video median to just below saturation are detected (C). The area of detected regions varies (D) with the smallest ROIs corresponding to cross-sections of dendrites (E). Neighboring regions with sufficiently high correlation are merged (F), those with lower correlation are not merged (G). In F, we plot the ROIs before and after merging along with the corresponding neuropil-corrected time courses. In G, we plot the separate ROIs and the neuropil-corrected time courses. The proposed method naturally facilitates neuropil-correction, the removal of the weighted, local neuropil time course from the raw cellular time course (H).

