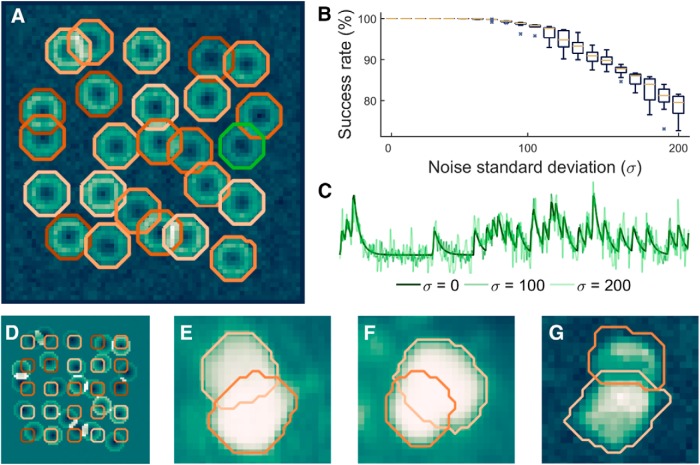
Figure 3.
ABLE demixes overlapping cells in real and simulated data. With high accuracy, we detect the true boundaries of overlapping cells from noisy simulated data, the detected contours for one realization of noise with SD (σ) 60 are plotted on the correlation image in A. Given an initialization on a fixed grid, displayed on the mean image in D, we detect the true cell boundaries with success rate of at least 99% for σ < 90 (B). The central marker and box edges in B indicate the median and the 25th and 75th percentiles, respectively. For noise level reference, we plot the average time course from inside the green contour in A at various levels (C). ABLE demixes overlapping cells in real GCaMP6s mouse in vivo data, detected boundaries are superimposed on the mean image (E, F) and correlation image (G), respectively.

