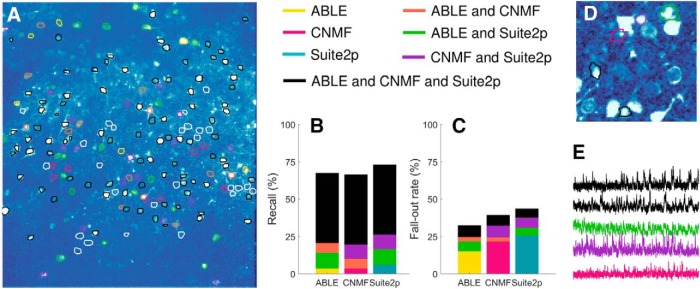
Figure 5.
We compare the segmentation results of ABLE, CNMF (Pnevmatikakis et al., 2016), and Suite2p (Pachitariu et al., 2016) on a manually labeled dataset from the Neurofinder Challenge. On the correlation image, we plot the boundaries of the manually labeled cells color-coded by the combination of algorithms that detected them (A), undetected cells are indicated by a white contour. Suite2p detected the highest proportion of manually labeled cells (B), whereas ABLE had the lowest fall-out rate (C), which is the percentage of detected regions not present in the manual labels. Some algorithm-detected ROIs that were not present in the manual labels are detected by multiple algorithms (D) and have time courses which exhibit stereotypical calcium transient activity (E). The correlation image in D is thresholded to enhance visibility of local peaks in correlation. In E, we plot the extracted time courses of the ROIs in D.

