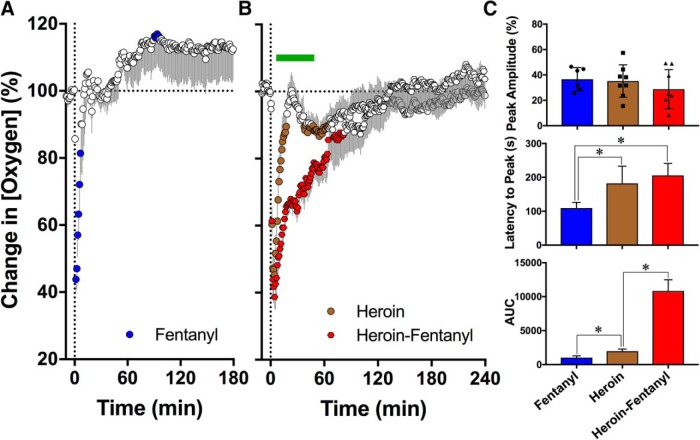
Figure 1.
Changes in NAc oxygen levels (normalized as percentage vs baseline = 100%) induced by intravenous injections of fentanyl (40 µg/kg; A), heroin (400 µg/kg; B), and their mixture (40 µg/kg fentanyl + 360 µg/kg heroin; B) in awake, freely moving rats. Changes in NAc oxygen were significant for each of the three treatments. Values significantly different from baseline (p < 0.05; horizontal hatched lines) are shown as filled symbols. Moment of drug injection (time = 0 min) is shown as vertical hatched line. C, Mean values of three parameters of oxygen response [peak amplitude, s; latency to peak, s; and area under the curve for the total oxygen decrease (AUC)]. Asterisks denote significant between-group differences (p < 0.05). Symbols in peak amplitude graph show individual values of oxygen decreases in percentage of baseline.

