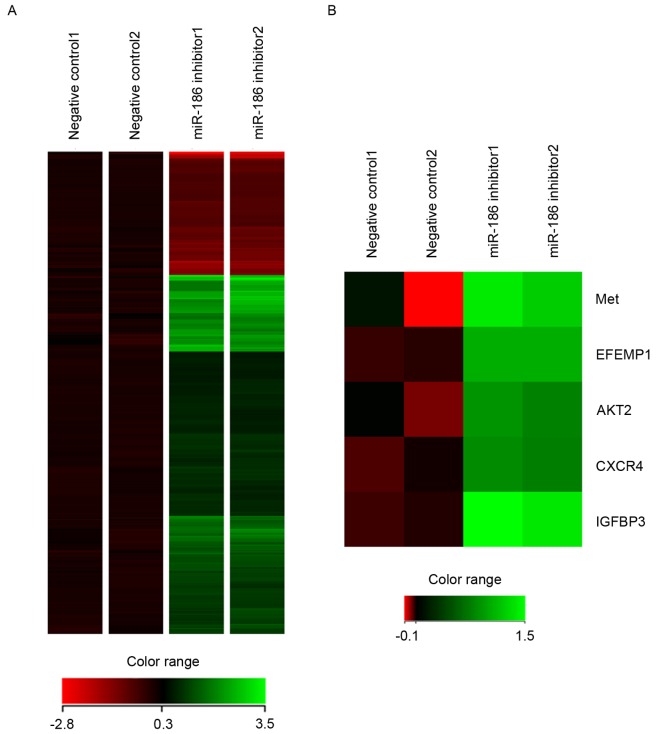
Figure 5.
Inhibition of miR-186 affects gene expression profiles in GIST-T1 cells. (A) Heat map showing the changes in gene expression subsequent to miR-186 inhibition in GIST-T1 cells. Genes upregulated or downregulated by the miR-186 inhibitor (>1.5-fold) were selected, and hierarchical clustering was subsequently performed. (B) Heat map of metastasis-associated genes upregulated by miR-186 inhibition in GIST-T1 cells. miR, microRNA; GIST, gastrointestinal stromal tumor; Met, hepatocyte growth factor receptor; EFEMP1, epidermal growth factor-containing fibulin-like extracellular matrix protein 1; AKT2, AKT serine/threonine kinase 2; CXCR4, CXC chemokine receptor 4; IGFBP3, insulin-like growth factor-binding protein 3.

