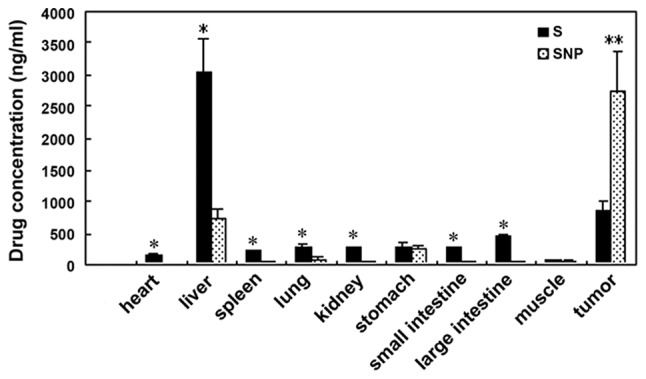
Figure 6.

In vivo tissue distribution of sorafenib nanoparticles was measured after three weeks. The sorafenib concentration in SNP was higher than S in tumor tissues. In peritumor tissues, sorafenib concentration in SNP was lower than S. The bars represent the means ± standard deviation of two independent experiments. *P<0.05, **P<0.01 between S and SNP. S, sorafenib group; SNP, sorafenib nanoparticle group.
