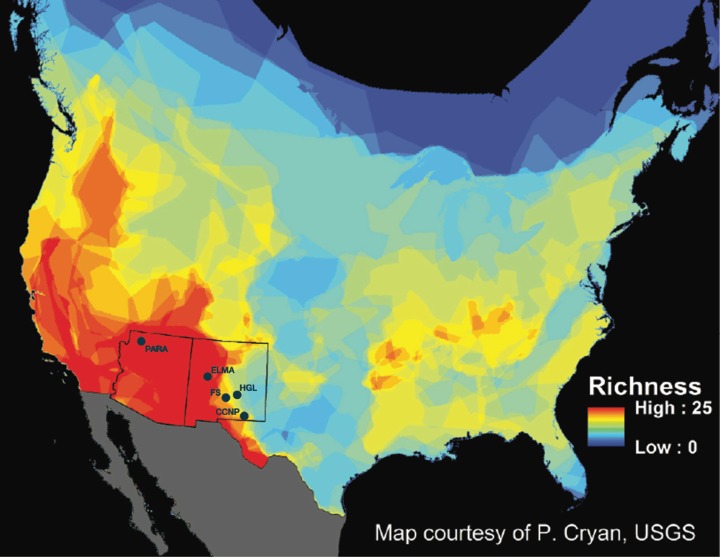
Figure 1. New Mexico and Arizona are hotspots of bat diversity.
Map of bat species richness in the United States (US) and Canada. Total number of bat species occurring in each area calculated by counting the number of overlapping species distributions. Warmer colors represent areas with higher species richness and cooler colors represent areas with lower species richness. Sample locations are marked as follows: PARA (Grand Canyon-Parashant National Monument), ELMA (El Malpais National Monument), FS (Fort Stanton-Snowy River Cave National Conservation Area), HGL (High Grasslands), CCNP (Carlsbad Caverns National Park). Map courtesy of P. Cryan, USGS.

