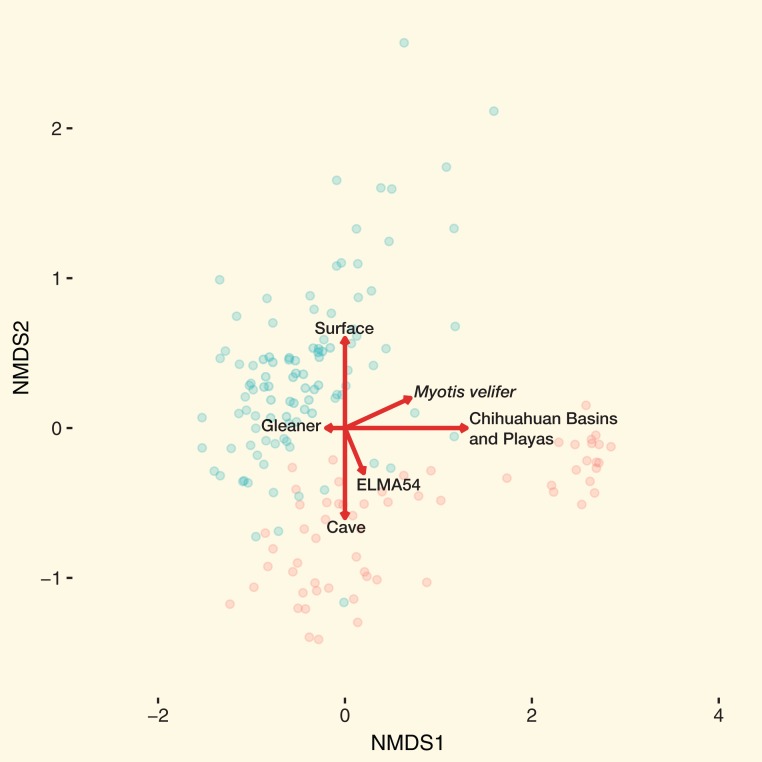
Figure 5. Main drivers of bat skin bacterial community dissimilarity.
NMDS with samples colored by cave-caught or surface-netted. The arrows are the maximum variation in contributions to community dissimilarity derived from the Bayesian hierarchical models. Red circles of cave-caught bats and the blue circles are surface-netted bats.

