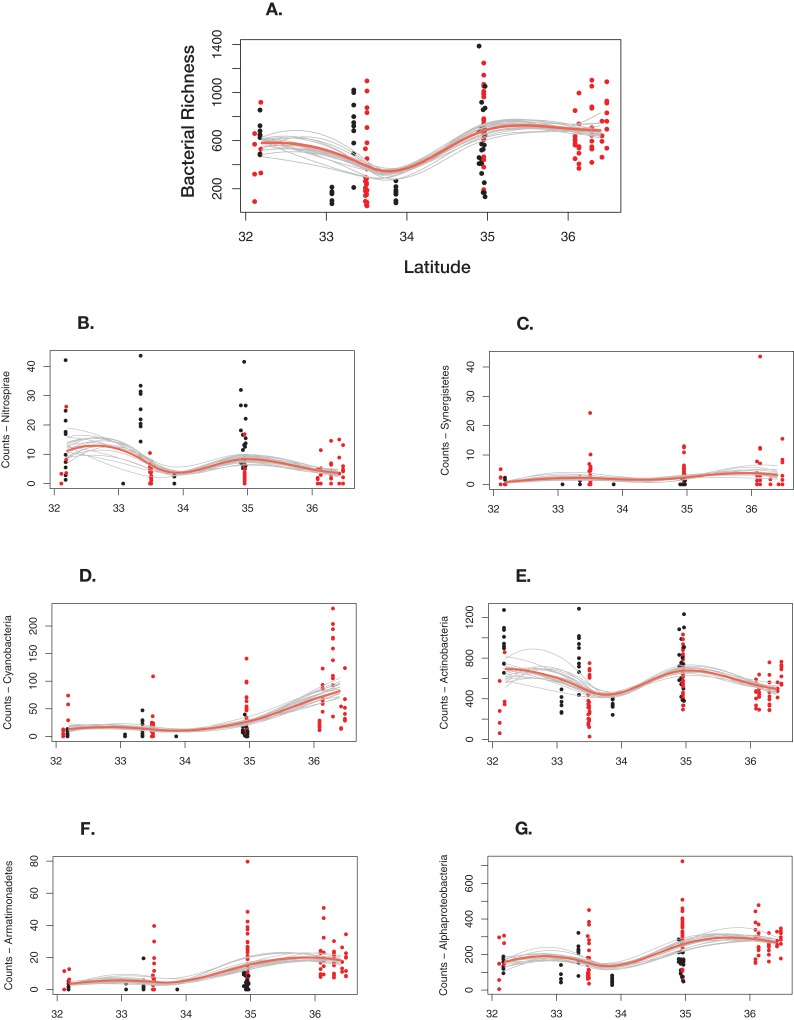
Figure 7. Differential response to latitudinal gradient by bacteria phylum and class.
(A) Overall bacterial richness for each sample by latitude. (B) Nitrospirae. (C) Synergistetes. (D) Cyanobacteria. (E) Actinobacteria. (F) Armatimonadetes. (G) Alphaproteobacteria. Bayesian bootstrapped loess line of bacteria phylum richness on individual bats by changing latitude. The red line is the 95% uncertainty interval line and 20 additional gray lines show measures of uncertainty. The red dots are surface-netted bats and the black dots are cave-caught bats.

