Figure 9.
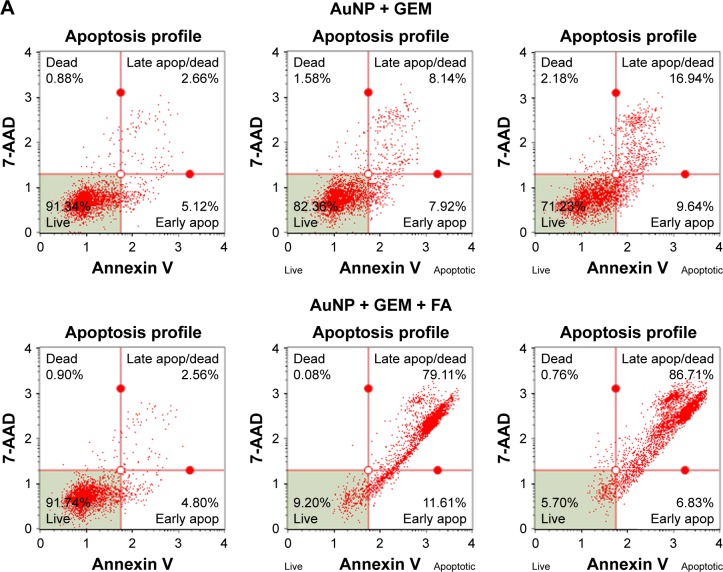
(A) Flow cytometry plots of 7-AAD staining (DNA accessibility index) vs annexin V staining (membrane damage index) for MDA-MB-231 breast cancer cells treated for 72 h with indicated concentration of drug-loaded nanocarriers: (column 1) 0 nM, (column 2) 25 nM, and (column 3) 50 nM, using different nanocarriers: (row 1) AuNP@MBA/GEM, labeled as AuNP + GEM; (row 2) AuNP@MBA,PATP/GEM,FA, labeled as AuNP + GEM + FA; and (row 3) AuNP@MBA,PATP/GEM,DOX,FA labeled as AuNP + GEM + DOX + FA. (B) Dependence of the fraction of apoptotic cells on nanocarrier concentration for these nanocarriers (three biological replicates were quantified; the error bars represent standard deviation).
Abbreviations: apop, apoptotic; 7-AAD, 7-aminoactinomycin D; AuNP, gold nanoparticle; DOX, doxorubicin; FA, folic acid; GEM, gemcitabine; MBA, mercaptobenzoic acid; PATP, p-aminothiophenol; SERS, surface-enhanced Raman scattering.


