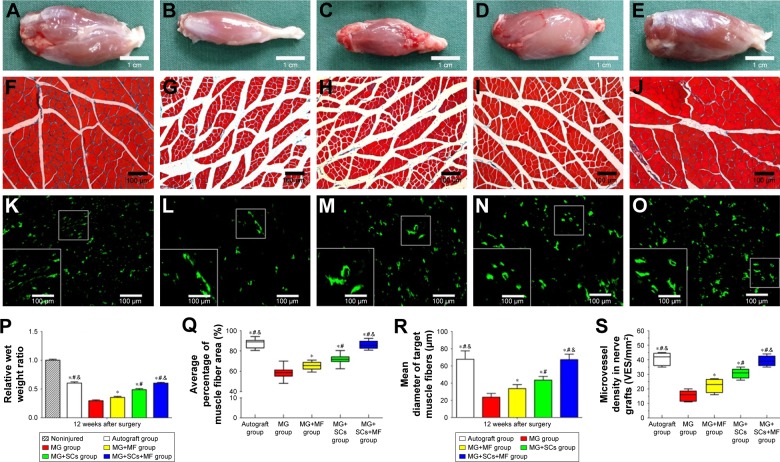
Figure 11.
Weighting and histology of target gastrocnemius muscle, and quantification of microvessel density (MVD) in each group.
Notes: (A–E) The morphology of the gastrocnemius muscle in the autograft group, MG group, MG+MF group, MG+SCs group, and MG+SCs+MF group at 12 weeks postoperation, respectively. (F–J) The characteristic light photographs of the cross-sectional gastrocnemius muscle following Masson trichrome staining (from left to right: the autograft group, MG group, MG+MF group, MG+SCs group, and MG+SCs+MF group) at 12 weeks postoperation. (K–O) The characteristic photographs of MVD staining (from left to right: the autograft group, MG group, MG+MF group, MG+SCs group, and MG+SCs+MF group) at 12 weeks postoperation, respectively. (P) The relative wet weight ratio in each group is shown. (Q) The mean percentage area of muscle fibers in each group is shown. (R) The average diameter of muscle fibers in each group is shown. (S) The quantitative analysis of MVD in each group is shown. *p<0.05 compared to MG group; #p<0.05 compared to MG+MF group; &p<0.05 compared to MG+SCs group; all results are expressed as the mean ± SD.
Abbreviations: MG, the rats were bridged with the magnetic scaffold; MG+MF, the rats were bridged with the magnetic scaffold and under MF exposure after surgery; MG+SCs, the rats were bridged with the Schwann cells-loaded magnetic scaffold; MG+SCs+MF, the rats were bridged with the Schwann cells-loaded magnetic scaffold and under MF after surgery; SCs, Schwann cells; MF, magnetic field.

