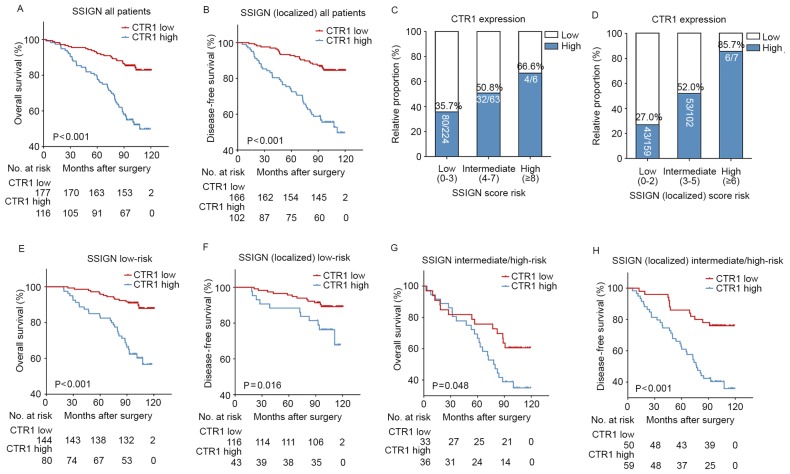
Figure 2.
CTR1 expression stratified by SSIGN/SSIGN (localized) score and Kaplan-Meier analyses of OS/DFS. (A) OS and (B) DFS rates of all patients according to CTR1 expression. Relative proportions of CTR1 expression status in three risk groups according to the (C) SSIGN and (D) SSIGN (localized) score. High CTR1 expression rates were elevated as the risks increased. (E) OS and (F) DFS rates of low-risk patients according to CTR1 expression. (G) OS and (H) DFS rates of intermediate/high-risk patients according to CTR1 expression. CTR1, copper transporter 1; SSIGN, Mayo Clinic stage, size, grade and necrosis; OS, overall survival; DFS, disease-free survival.

