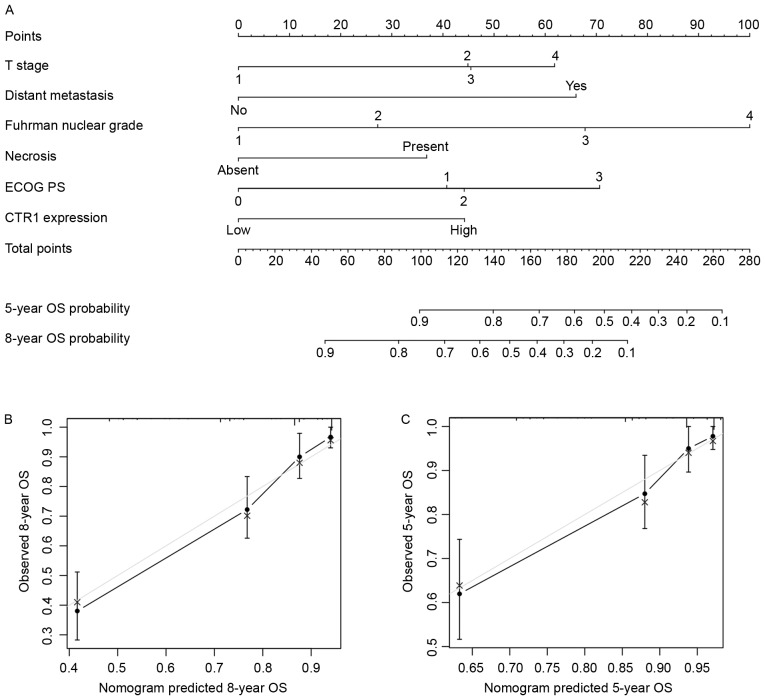
Figure 3.
Nomogram for predicting 8- and 5-year overall survival in patients with clear cell renal cell carcinoma. (A) Nomogram for predicting clinical outcomes, integrating T stage, distant metastasis, Fuhrman nuclear grade, necrosis, ECOG PS and tumor CTR1 expression. (B) Calibration plot for predicted and observed 8-year OS rate. (C) Calibration plot for predicted and observed 5-year OS rate. Grey line, ideal model; vertical bars, 95% confidence interval. ECOG PS, Eastern Cooperative Oncology Group performance status; CRT1, copper transporter 1; OS, overall survival.

