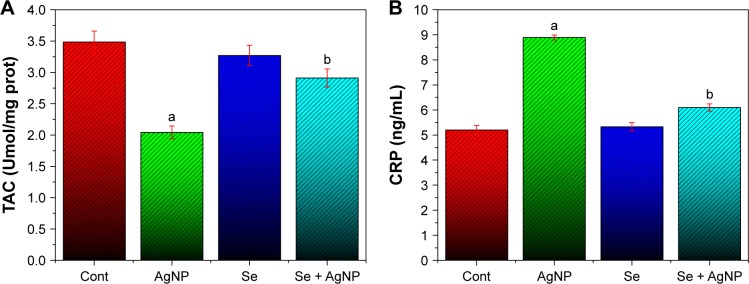
Figure 4.
(A, B) Influence of Se on AgNP-induced TAC and CRP levels in serum compared with their respective control groups. The data represent means ± SEM. a: P<0.05 with respect to the control group (significant). b: P<0.05 with respect to AgNP group (significant).
Abbreviations: Se, selenium; AgNP, silver nanoparticle; TAC, total antioxidant capacity; CRP, C-reactive protein; Cont, control; prot, protein.

