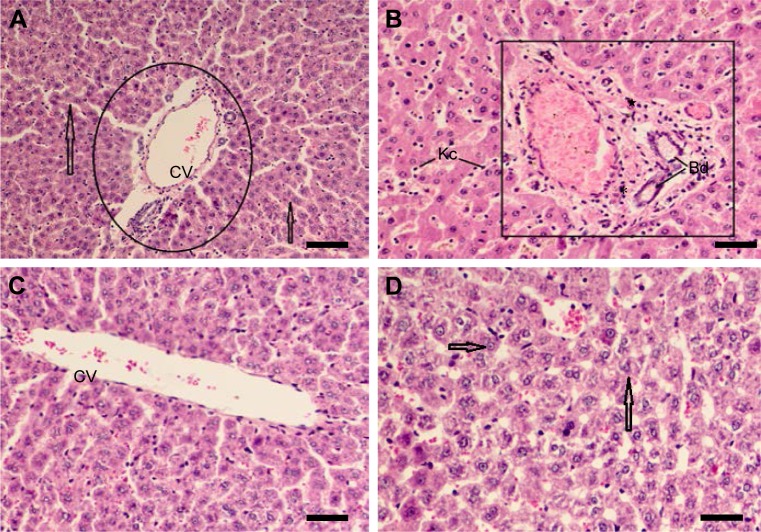
Figure 5.
Histological evaluation of Se and AgNPs treatment of rats. (A) Control group, normal liver architecture showing portal area (circle), hepatic strands of eosinophils (arrows), and central vein. (B) AgNPs treated group showing portal tract expansion (square), dense infiltration of mononuclear cells (star), increase in Kupffer cells (Kc), proliferated bile duct (Bd), and accumulation of cells around central vein. (C) Section of rat liver (Se-treated) showing normal hepatocytes and central vein similar to control. (D) Section of rat livers (Se + AgNPs treated) showing normal cellular appearance and decrease in toxicity (arrows). Scale bar 50 μm.
Abbreviations: Se, selenium; AgNPs, silver nanoparticles; CV, central vein.

