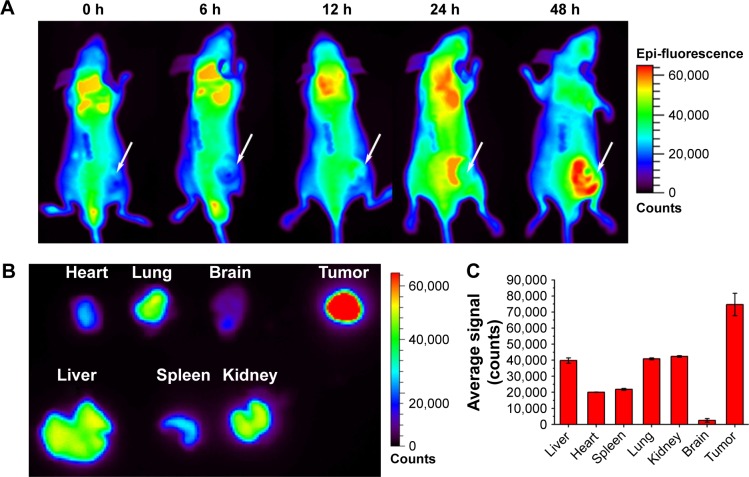
Figure 5.
NIR imaging and biodistribution analysis. (A) The fluorescence images of mice with prostate cancer injected with NPs (the white arrows indicated tumor area). (B) Ex vivo fluorescence images of major organs from those mice at 48 h. (C) Semiquantitative biodistribution of NPs in major organs. The data are shown as mean ± SD (n=3).
Abbreviations: NIR, near-infrared; NPs, nanoparticles.

