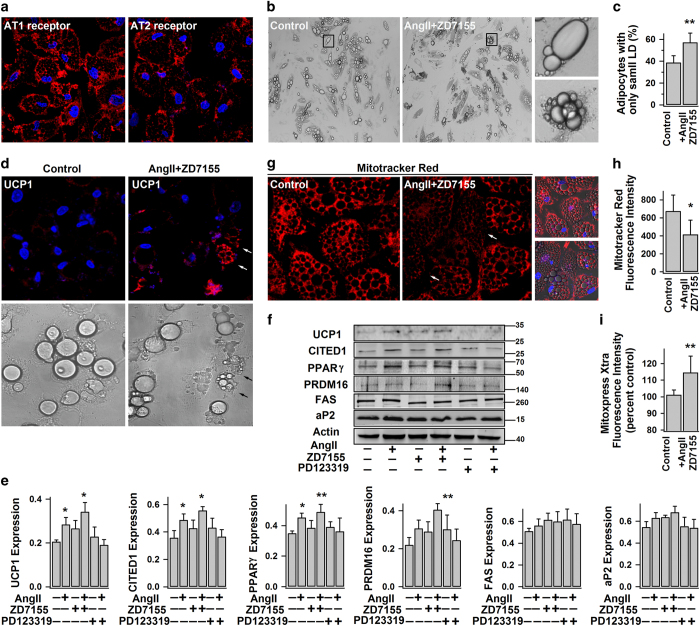
Figure 6.
AngII–AT2R increases UCP1 expression and basal metabolic activity in human white adipocytes. (a) The representative confocal images of immunostained AT1R and AT2R in human white adipocytes (day 14) (from three different experiments). (b–e) Human white adipocytes were treated without (−) (control) or with (+) AngII, ZD7155 or PD123319 for 4–5 days. (b and c) The representative bright-field images of differently treated adipocytes (from 3 different experiments). The percentage of adipocytes with only small LDs (the largest LD smaller than 10–15 μm in diameter) (mean±s.e.m.; n=10 images from 3 different experiments), is shown in (c). (d) The representative confocal images of immunostained UCP1 in adipocytes and their correspondingly bright-field images (from 3 different experiments; arrow shows the intense UCP1staining in beige adipocyte). (e and f) Shown are the representative immunoblots of protein expressions and the statistics (mean±s.e.m., n=4, normalized to actin density). (g and h) The representative confocal images of adipocytes showing the changes of mitochondrial membrane potential (detected by MitoTracker Red), and the statistics of fluorescence intensity (mean±s.e.m., n=12, from 3 different experiments). (i) Lifetime fluorescence value of MitoXpress-Xtra assessed as an indication of oxygen consumption rate (at 60 min; mean±s.e.m., n=6, from 2–3 separate experiments) in adipocytes. *P<0.05 and **P<0.01 versus control.

