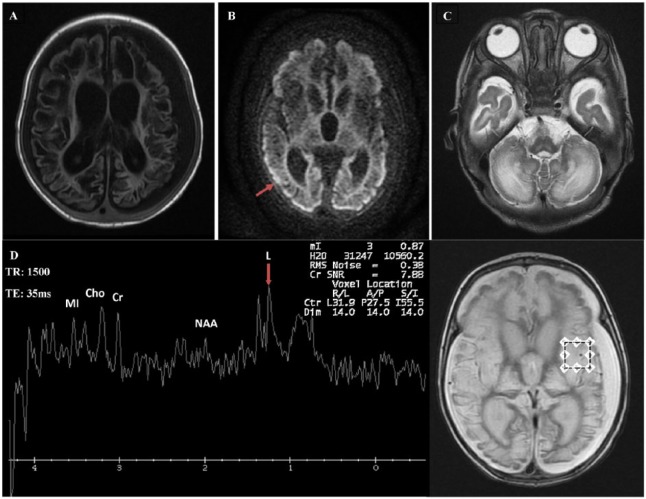
Figure 1.
Brain MRI and MRS. (A)-T1 weighted axial section showing extensive brain damage with cystic encephalomalacia, bilateral subdural effusion, and ex vacuo enlargement of the ventricles. (B) Diffusion-weighted image, axial section, showing restricted diffusion in the margin of the cerebral cortices bilaterally (arrow). (C) T2-weighted axial section showing abnormal signaling in the cerebellum and volume loss in brain stem. (D) MRS showing mild lactate peak at 1.3 ppm (arrow). TE: 35 ms. Ch indicates choline; Cr, creatine; L, lactate; MI, myoinositol; MRI, magnetic resonance imaging; MRS, magnetic resonance spectroscopy; NAA, N-acetylaspartate; TE, echo time.

