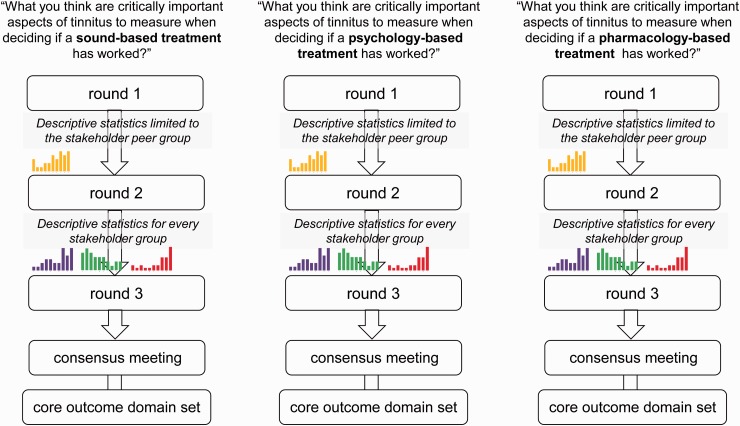
Figure 2.
A schematic diagram of the online Delphi process, including Rounds 1 to 3 and the face-to-face consensus meetings. The colored histograms represent the planned graphical format of the results from the previous round. Single (yellow) histogram represents results for the peer stakeholder group. Purple, green, and red histograms represent results for each relevant stakeholder group (peer and otherwise).

