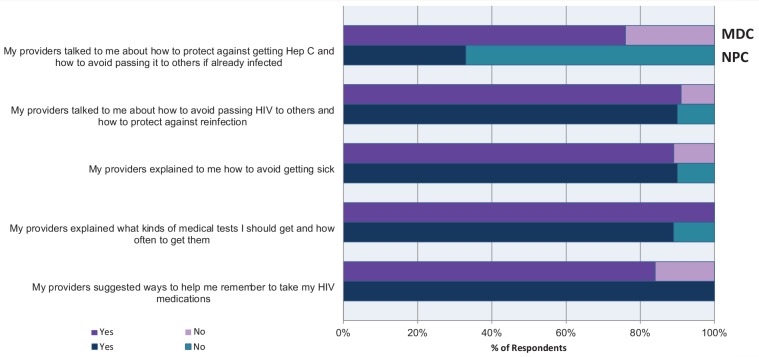
Figure 4.
Patient education: MDC vs NPC patient satisfaction*†
* Responses of “did not apply” or “don’t know” are excluded. †Questions with response rates of 100% were excluded from the figures. Please see the figure details for more information on these parameters. MDC, multidisciplinary clinic; NPC, nonphysician clinic

