
Figure 1.
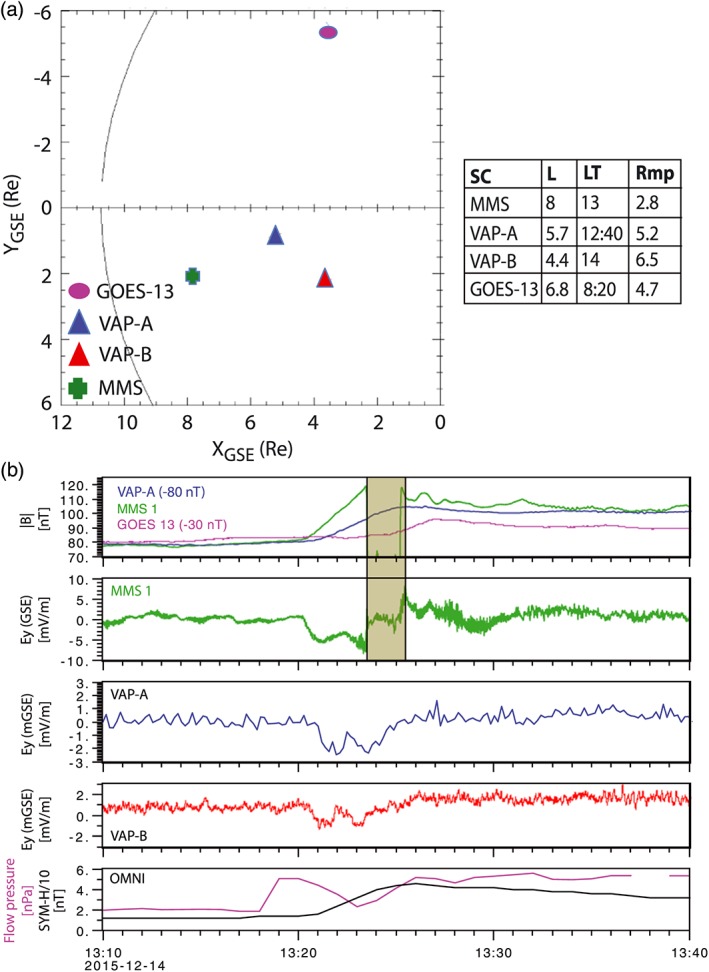
(a) Satellite locations at ~13:20 on 14 December 2015. (b, first panel) Btotal on VAP‐A (−80 nT) in blue, on MMS1 in green, and on GOES‐13 (−35 nT) in purple. Note that the rapid change seen on MMS at ~13:25 is a crossing into the magnetosheath and back into the magnetosphere. (b, second panel) E y on MMS1. (b, third panel) E y on VAP‐A (spin period resolution due to loss of one spherical probe). (b, fourth panel) E y on on VAP‐B. (b, fifth panel) solar wind pressure (purple) and SYM‐H (divided by 10, black).