
Figure 6.
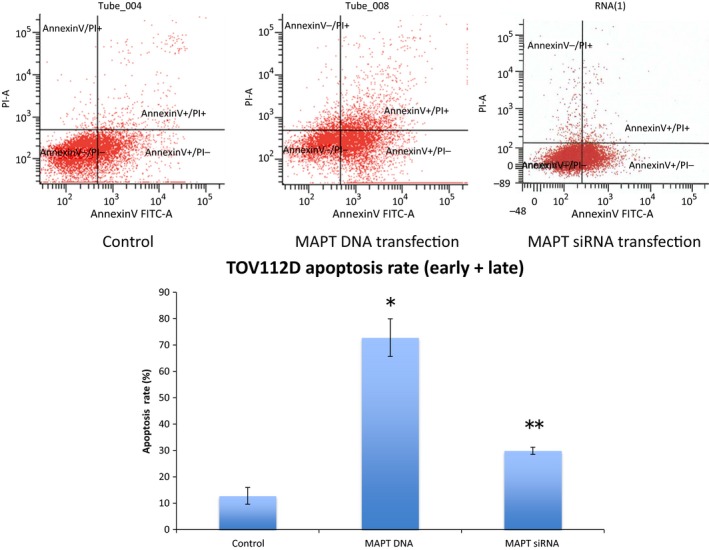
Apoptosis analysis. The Annexin‐V+/PI– cells show early apoptosis and the Annexin‐V+/PI+ cells show late apoptosis. The average total (early + late) apoptosis rate of the control cells was 12.8% (average early apoptosis, 11.3%; average late apoptosis, 1.5%). The average total apoptosis rate of the DNA‐transfected cells was 72.8% (average early apoptosis, 52.6%; average late apoptosis, 19.7%). There was a significant increase in apoptosis of the DNA‐transfected cells. *P<.0001, compared to the control. The average total apoptosis rate of the small interfering RNA (siRNA)‐transfected cells was 29.9% (average early apoptosis, 27.6%; average late apoptosis, 2.3%). There was a significant increase in apoptosis of the siRNA‐transfected‐cells. **P<.001, compared to the control. FITC , fluorescein isothiocyanate