Figure 2.

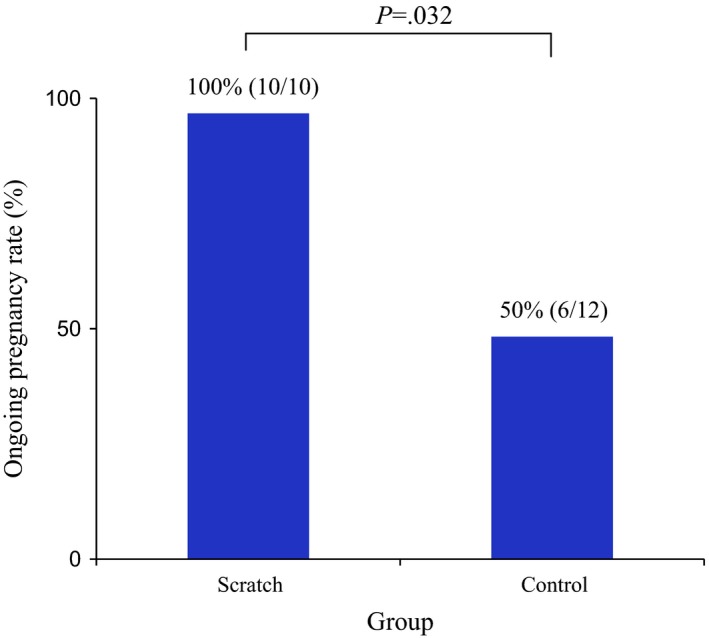
Ongoing pregnancy rate in the scratch and control groups. The rate was significantly higher in the scratch group (100% vs 50%, respectively; P=.032)

Ongoing pregnancy rate in the scratch and control groups. The rate was significantly higher in the scratch group (100% vs 50%, respectively; P=.032)