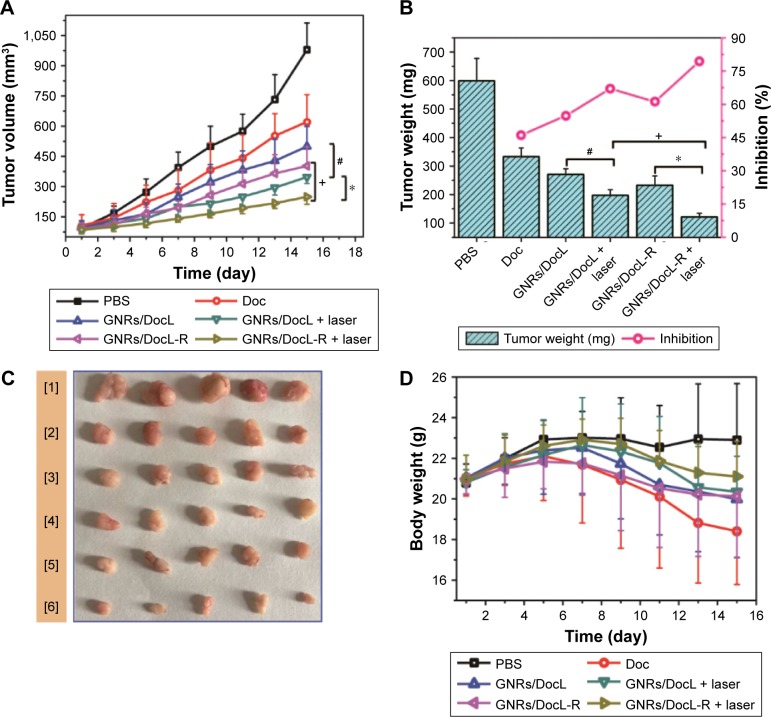
Figure 7.
In vivo evaluation of the antitumor efficacy of the listed treatments.
Notes: (A) Tumor volume data during 15 days of treatment with the listed formulations. (B) Tumor weight and calculated tumor inhibition rate after 15 days of treatment with the listed formulations. (C) Tumor images after 15 days of treatment with the listed formulations (1–6: saline; Doc solution; GNRs/DocL; GNRs/DocL + laser; GNRs/DocL-R; GNRs/DocL-R + laser, respectively). (D) Body weight data during 15 days of treatment with the listed formulations. Data are presented as mean ± SD (N=5). +GNRs/DocL-R vs GNRs/DocL-R + laser, p<0.05. *GNRs/DocL + laser vs GNRs/DocL-R + laser, p<0.01. #GNRs/DocL vs GNRs/DocL + laser, p<0.05.
Abbreviations: Doc, docetaxel; GNRs, gold nanorods; GNRs/DocL-R, GNRs/Doc-liposome-RLT.

