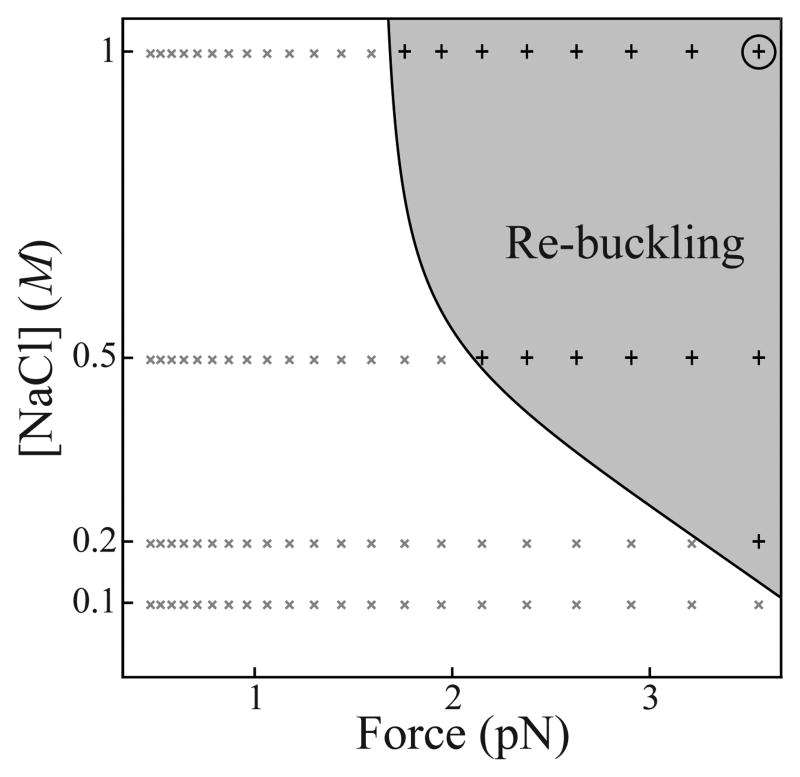
Fig. 3.
Experimental salt-force phase diagram of re-buckling for n = 2. Re-buckling requires high force and ionic screening. The shaded region represents conditions in which re-buckling occurred in greater than 50% of repeated measurements (+ points; see Figs. S2 and S3 in Supporting Information). The data in Fig. 2 were collected at 3.6 pN and 1 M salt (circled).

