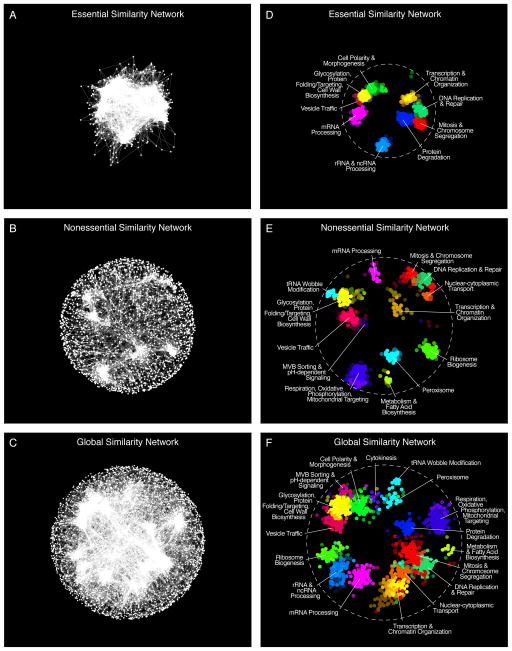
Figure 1. A global network of genetic interaction profile similarities.
(A) The essential similarity network was constructed by computing Pearson correlation coefficients (PCCs) for genetic interaction profiles (edges) of all pairs of genes (nodes) in the essential genetic interaction matrix (ExE). Gene pairs whose profile similarity exceeded a PCC > 0.2 were connected and graphed using a spring-embedded layout algorithm. Genes sharing similar genetic interactions profiles map proximal to each other, whereas genes with less similar genetic interaction profiles are positioned further apart. (B) A genetic profile similarity network for the nonessential genetic interaction matrix (NxN). (C) A global genetic profile similarity network encompassing all nonessential and essential genes was constructed from the combined NxN, ExE and NxE genetic interaction matrices. (D) The essential similarity network was annotated using the Spatial Analysis of Functional Enrichment (SAFE), identifying network regions enriched for similar GO biological process terms, which are color-coded. (E) The nonessential similarity network annotated using SAFE. (F) The global similarity network annotated using SAFE.

