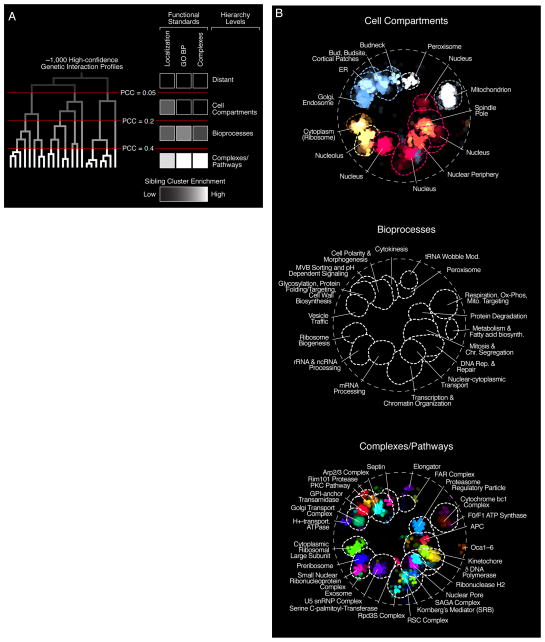
Figure 2. The global genetic interaction profile similarity network reveals a hierarchy of cellular function.
(A) A schematic representation of a genetic interaction profile-derived hierarchy. Genes with highly correlated genetic interaction profiles (PCC > 0.4) form small, densely connected clusters representing specific pathways or protein complexes. At an intermediate range of profile similarity (0.2 < PCC < 0.4), sibling clusters representing distinct pathway or complexes combine together into larger biological process enriched clusters. At a lower range of profile similarity (0.05 < PCC < 0.2), bioprocess-enriched clusters, in turn, combine together to form larger clusters corresponding to different cell compartments. The grey-white scale bar illustrates enrichment of sibling clusters for the same set of terms from the indicated functional standard. See also fig. S7. (B) The genetic network hierarchy visualized using SAFE analysis, which identified regions in the global similarity network enriched for specific cellular compartments, biological processes or protein complexes.

