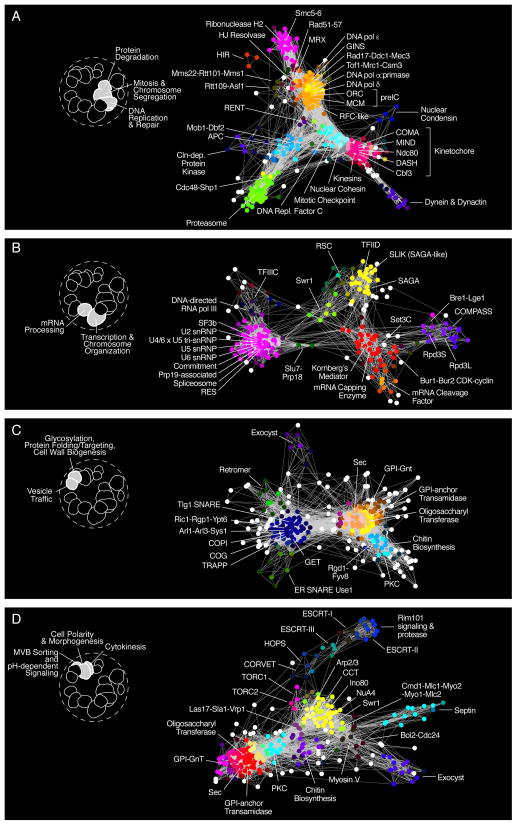
Figure 3. Genetic interaction profile similarity sub-networks.
Genes belonging to the indicated biological process-enriched clusters were extracted from the global network and laid out using a spring-embedded layout algorithm. Sub-networks were annotated using SAFE to identify network regions enriched for specific protein complexes. (A) Protein complexes localized within the Protein Degradation, Mitosis & Chromosome Segregation, and DNA Replication & Repair, enriched bioprocess clusters shown in Fig. 1F. (B) Protein complexes localized within the Transcription & Chromatin Organization and mRNA Processing-enriched bioprocess clusters shown in Fig. 1F. (C) Protein complexes localized within the Glycosylation, Protein folding/Targeting, Cell Wall Biosynthesis and Vesicle Traffic-enriched bioprocess clusters shown in Fig. 1F. (D) Protein complexes localized within the MVB Sorting & pH-dependent Signaling, Cell Polarity & Morphogenesis, and Cytokinesis enriched bioprocess clusters shown in Fig. 1F.

